Trading Charts


Swing trading charts are one of the most useful tools for technical analysis. Understanding them can enhance your trading strategies and help you to spot patterns. The best charts can be used for any market or asset, including forex pairs, cryptocurrencies and stocks.
This guide will explain what swing trading charts are and how they work, plus their pros and cons. We’ll also cover some of the most popular trading charts available, including those that are free online.
Trading Charts Explained
Swing trading charts display information that can help you decide when to enter and exit a position. The simplest charts can cut through the noise by showing the real-time prices of an asset over a specific interval. Complex charts can also be used to display further information, such as various tick data and reversals.
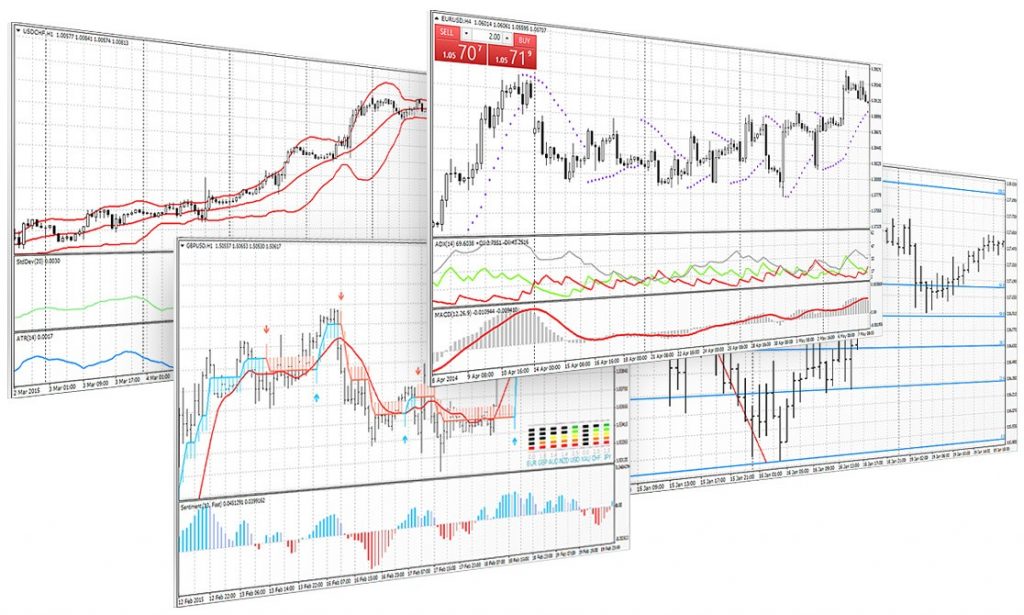
MetaTrader 4 Charts
How Do Charts Work
A trading chart will track an asset, like a stock, and plot the price traded over a set interval. This allows traders to visualize how much an investment has grown or shrunk over a period. Reading charts for swing trading can make technical analysis much simpler, especially with the availability of hourly and daily timeframes. Typically, traders combine the use of charts with technical indicators, which can identify new momentum and trends.
Why Use Charts?
Trading charts are an important tool for technical analysis, for many reasons:
- Charts allow you to view the overall trend of a market or equity. This simplifies the otherwise complex process of spotting trends and patterns.
- Charts cut through the noise, helping to accurately apply other forms of technical analysis that are not so time-sensitive.
- There is wide variety when it comes to charts, from viewing the overall market to locating complex trends through price channels. They are also customisable and adaptable to the tools and indicators you use.
- Charts allow you to position risk management tools whilst you trade, such as stop-loss and take-profit orders.
Best Swing Trading Charts
Determining the best chart for you depends on your trading preferences and objectives. There are numerous swing trading charts available, from Tick charts to Candlestick charts. Each comes with its own advantages and disadvantages, so no chart will be perfect for everyone.
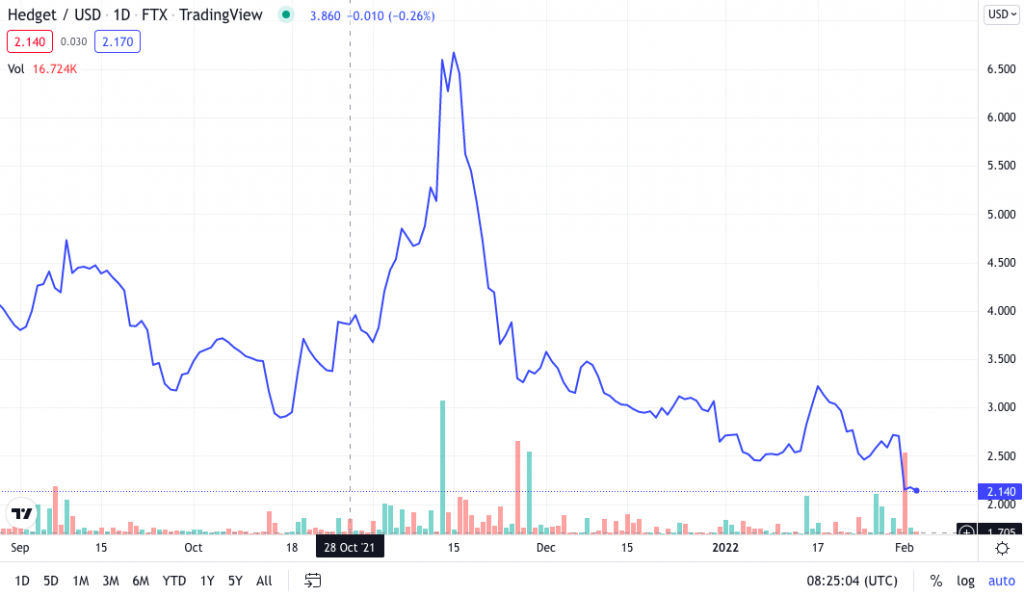
Line Charts
Line charts are one of the most popular and straightforward intra-swing trading charts available. Users will choose the best interval, typically across days or weeks for swing trading, and the chart will then show all closing prices over that period.
The chart displays as an easy-to-understand continuous line. But while this is easy to read, you should not base all decisions on this data as other vital information will be missing. As such, line charts can be a great way of viewing overall market data.
Bar Charts
Bar charts are made up of vertical lines that represent price range over a time interval. They are essentially an extension of line charts, showing the opening, high and low prices, as well as the closing price. The horizontal lines represent the difference between the opening and closing price.
Bar charts are still easy to digest, but they add some valuable information that line charts fail to include.
Tick Charts
Tick charts are ideal for a day trading strategy, but this does not mean they cannot be applied to swing trading. The bars on a tick chart are added based on a chosen number of transactions. For example, a 1500 tick chart creates a new bar for every 1500 transactions.
Tick charts are not impacted by time. When there is a high trading volume, bars will be added more frequently, while in slow periods they could take days. Tick charts are particularly useful in periods of high volume, displaying more crucial information than other charts.
If you want to add swing trading tick charts to your repertoire, make sure it is set up with an appropriate number of transactions. 400 tick charts are perfect for day trading, but less suited to swing trading. Start with a 1500 tick chart and find a number that works allows you to read it effectively.
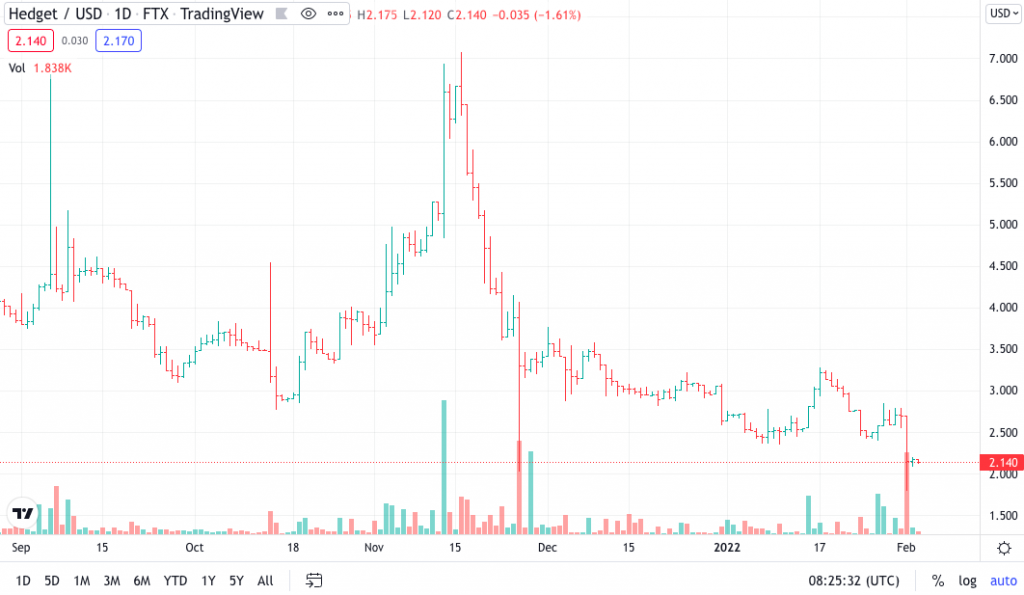
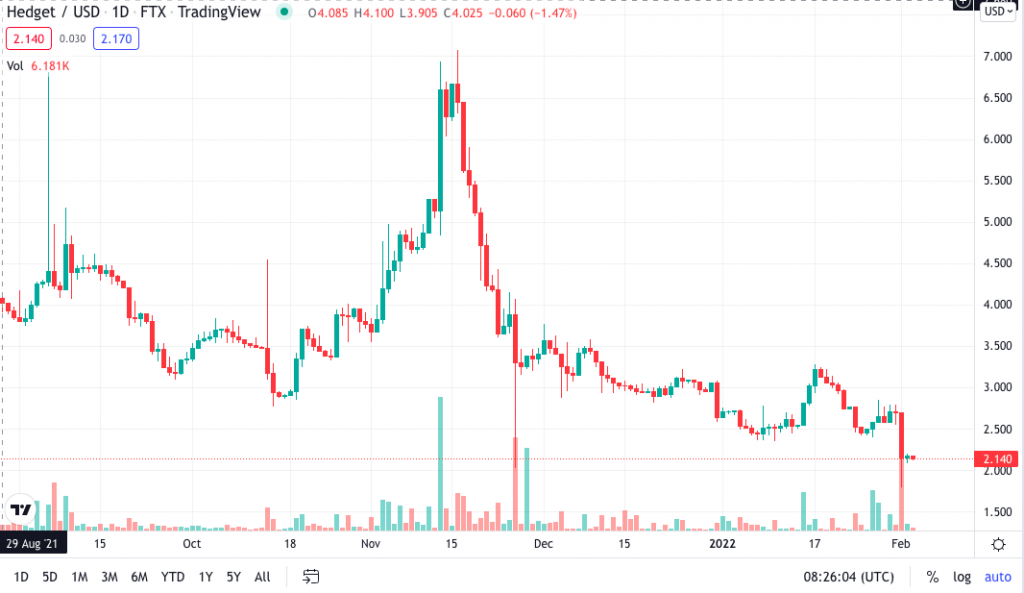
Candlestick Charts
Candlestick charts are similar to bar charts and can come in different variations, including Heikin Ashi. The primary difference between candlesticks and bars is that the relationship between the open and close price is depicted by the colour of the body as opposed to the horizontal lines.
Swing trading with Heiken Ashi charts is very popular, and you may have come across PDFs before. Heikin Ashi charts originated from Japan in the 1700s and are composed of a series of open-high-low-close (OHLC) candles set apart by a time series. They can be understood easily and are ideal for spotting trends and reversals.
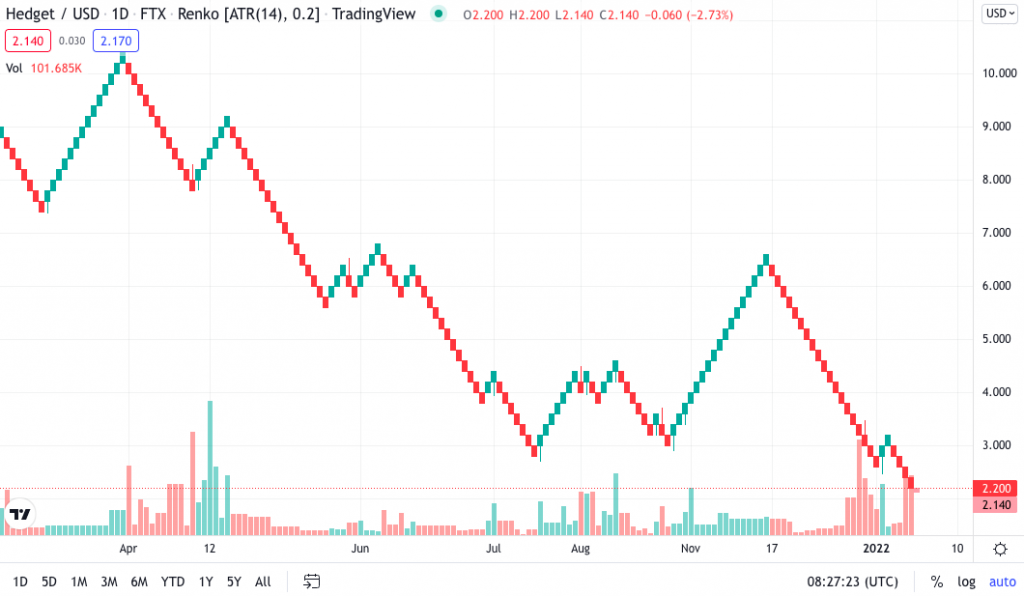
Renko Charts
Renko charts are great for swing trading, originating from Japan and named after the Japanese word for brick (Renga). They only show price movement and do not indicate time or volume. A new brick is added when the price of the asset exceeds the top or bottom of the previous one. Green bricks are added when the trend moves upwards and red bricks are added when the trend moves down. These charts are easy to read and can be used to identify support and resistance levels.
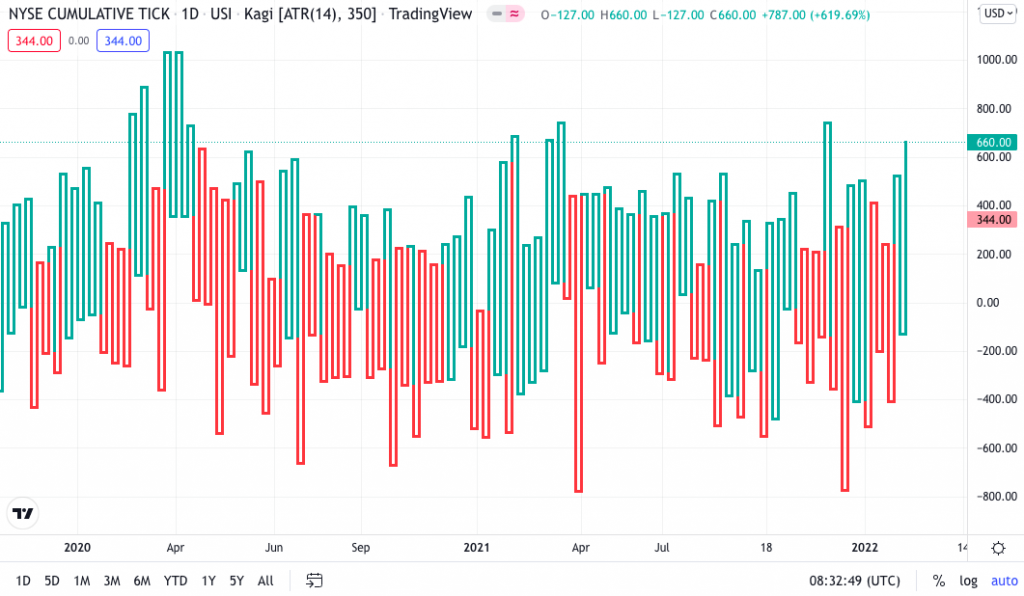
Kagi Charts
Kagi charts are simple to set up. All you need to specify is the reversal amount either in percentage or price change. When the price turns in the opposite direction by the specified amount, the chart changes direction.
Line width plays an important part in Kagi charts. If the market rises above the previous swing, the line will thicken. If it falls, the line displayed will be thinner. Kagi charts can help find support and resistance levels and are therefore well suited to swing trading.
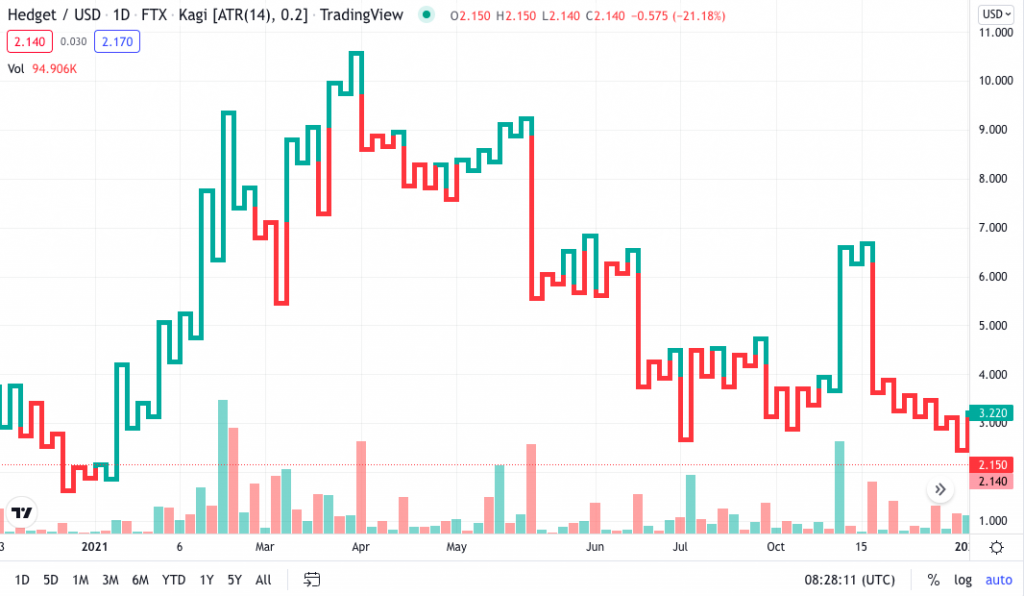
Chart Setup
When you set up your charts, you may need to consider a range of factors. This could be the tick number, time interval, reversal amount or volume. The key is to set these up specific to you. For example, swing trading using candlestick charts is a typical place to start for many traders, but this will depend on your preferences. In addition, swing traders will be conducting trades over days or weeks, so the time frame you use should reflect this.
Technical Indicators
Technical indicators can improve the decision-making process but adding too many will over-complicate your charts. Some of the most popular indicators are:
- Volume indicator: Volume is an essential tool for swing traders. It indicates the strength of a new trend. In principle, a trend with a high volume is going to be stronger than one with weak volume.
- Moving averages (MAs): Moving averages calculate the mean of a market’s price movements over a set interval. They are usually used to confirm trends rather than predict them. MAs can be used to indicate a change in momentum. If a faster MA crosses a slower one, it can indicate a bull move, and vice versa.
- Relative strength index (RSI): RSI shows whether a market is overbought or oversold and can indicate whether a swing may be about to occur. As an oscillator, it periodically measures the number and size of a market’s positive and negative closes. Anything over 70 is overbought, while anything under 30 is oversold.
- Stochastic oscillator: This is another type of momentum indicator. It compares the closing price of a market to the range of prices over a set period. If the reading is over 80, the market is overbought, whereas if it is under 20, it is considered undersold.
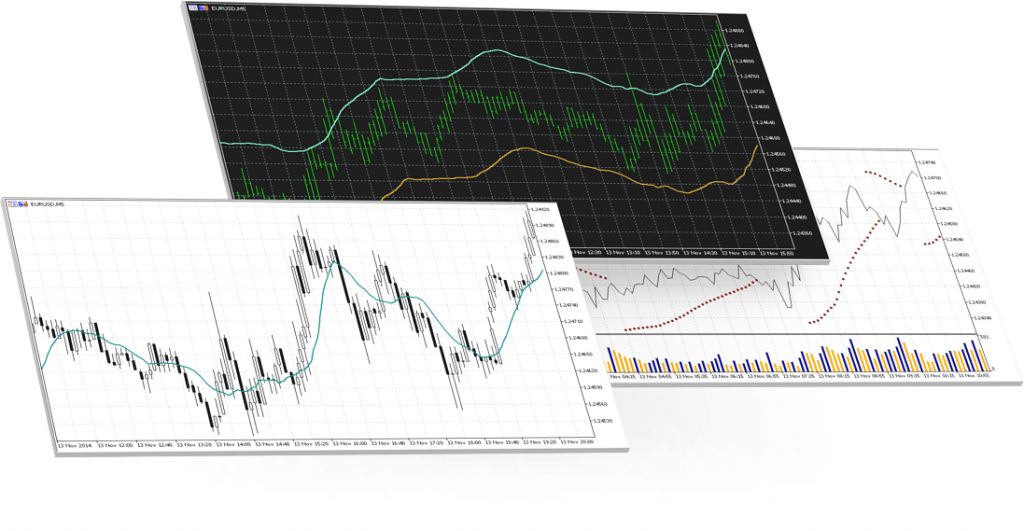
Chart Software
There is plenty of charting software available to assist swing trading. MetaTrader is great for forex daily charts, offering a range of in-depth and easy to navigate trading charts. It can be used through the desktop app, or on mobile. Sierra Chart is another piece of software that provides great swing trading charts as well as a range of additional technical analysis tools. Equally, NinjaTrader and eSignal provide good packages.
MetaTrader 5 Charts
If you want a totally free package, do not fear, there are plenty around. Technician, TradingView and FreeStockCharts provide real-time charts for a range of stocks, forex, crypto and futures. They allow you to select time frames and use other tools like indicators.
Pros of Trading Charts
We have summarised a few key advantages of swing trading charts:
- Easy to combine with algorithms
- Display lots of information
- Work well with indicators
- Fully customizable
- Easy to digest
Cons of Trading Charts
Our research did flag some potentials drawbacks of swing trading charts:
- May show patterns where there are none (cognitive bias)
- Too many indicators can be confusing
- Can give false confidence
Getting Started
If you want to start using swing trading charts, select a piece of software from the ones we covered earlier. Choose one of the premium options like MetaTrader or Sierra Chart for an optimal experience, some of which will be available for a free trial. Note that platforms such as MetaTrader will require you to open a brokerage account.
If you want a free package, use one of the free providers we listed. Once you have signed up, set up your charts, add indicators, and use them to work out trading decisions.
Final Thoughts
Swing trading charts can streamline your trading experience and provide a greater level of depth to your technical analysis strategy. They display valuable data in an easy-to-digest format, making it easy to spot trends and reversals. Follow the guides in this article to find the right software and charts for you and make sure you test your strategies using a demo account.
FAQ
What Is The Best Trading Chart?
There is no best trading chart suitable for everyone. You have to select the right one for you, based on your trading style and preferences. You will also need to take into account other factors, such as the time frames or indicators you wish to use.
What Time Frame Should I Use For Swing Trading?
Swing trading usually requires a time frame across days or weeks, so going without the 1-minute, 5-minute, 15-minute or 30-minute charts may be sensible. Pick one based on your trading habits and ensure that it displays the correct information for analysing your chosen market.
How Many Indicators Should I Use For Trading Charts?
Trading charts pair perfectly with indicators. However, using too many will make your charts confusing. Only select one or two indicators that will enhance the information displayed on the chart.
Will Trading Charts Increase My Profits?
Whether you’re using trading charts for Bitcoin or EURUSD, implementing these tools will not magically increase the number of winning trades you place. But what they will do is allow you to analyse the market and make educated trading decisions more effectively.
Are Trading Charts Available For Free?
There is a range of swing trading charts available to use for free. Sites like TradingView provide these free of charge and allow you to customize charts to suit your style. The MetaTrader packages also include popular charts such as candlesticks as standard.